Tuesday, November 8, 2011

Adobe’s Solutions for Manufacturing

Adobe Systems has historically focused upon creating multimedia and creativity software products, with a more-recent foray towards rich Internet application software development [http://en.wikipedia.org/wiki/Adobe_software]. With ubiquitous products like Adobe Photoshop, InDesign, Illustrator, Fireworks, Acrobat, Flash etc I was surprised to see Adobe's offerings for the manufacturing world. (Maybe it’s there for some and maybe I have just noticed while writing my previous blog post “3D PDF Technology – Where it fits in”).

"Adobe and partner software can be used to publish, protect, review, and archive product data as part of these and other product lifecycle management (PLM) workflows: 3D model-based definition (3D MBD), Item master creation, First article inspection (FAI) reports, Engineering change orders (ECOs), RFPs/RFQs etc." [http://www.adobe.com/manufacturing/solutions/product_development/]

This image shows where Adobe is trying to push its product in the PLM world:


I am not sure how successful Adobe has been in its endeavor to optimize product development since they are so much PLM vendor dependent to tie up with actual PLM systems. However I do think Adobe will be successful in helping organizations create and deliver more effective technical communications and enhance customer service because of their history. From their site: "Leverage 2D and 3D engineering data in the creation of technical publications (Work instructions, Field service manuals, Training manuals etc) for manufacturing, assembly, sales, service, and support. Provide technical publication users with a much richer, easier to understand learning experience by sharing 3D data in a more secure, easy-to-use format — 3D PDF. Whether it's a local field service technician repairing a commercial pump or military personnel in a remote desert outpost maintaining an F/A-18, anyone, anywhere can view rich, interactive 3D manuals electronically with free Adobe® Reader® software, which is installed on over 90% of Internet-connected PCs." [http://www.adobe.com/manufacturing/solutions/work_instructions/]

Monday, November 7, 2011

3D PDF Technology – Where it fits in


I happened to read about PROSTEP PDF Generator 3D in CIMData’s website this weekend which lead me to explore the world of 3D PDF’s. I find interactive 3D PDF files pretty amazing. For those of you who haven’t had a chance to view them please click on this link: http://www.adobe.com/manufacturing/3dpdfsamples/3dsolutions/ to view sample 3D PDF files. There are several examples listed like:

     Turbine engine (PDF, 4.5M, Original CAD format: SolidWorks)

     Jet concept design (PDF, 4.7M, Original CAD formats: Siemens NX, CATIA V5, and Pro/ENGINEER Wildfire)

     Crankshaftassembly (PDF, 3.0M, Original CAD format: Pro/ENGINEER Wildfire)

I observed many tools when I opened these files in Adobe Reader including those to isolate Parts, different Part Rendering Modes including Transparent, Wireframes, Illustrations etc, different Model Rendering Modes, Model Tree highlighting - will highlight different parts in the model, 3D measurement tools, etc. PDF Generator 3D Reader Extensions Module offers the option of activating a large number of additional functions for using the generated 3D PDF documents in Adobe Reader. The recipient can, for example, add comments or fill in certain fields on a form. PDF Generator 3D Rights Management Module allows the information contained in the 3D PDF documents to be protected against access by unauthorized persons. Access rights can be restricted to a specific period of time and if necessary can be revoked when, for example, a document is no longer valid. Overall I feel it’s a good tool for visualization even though rendering and loading takes some time even with a powerful computer. For those interested in the details of the components of PDF Generator 3D have a look here:


I see 3 major advantages of using 3D PDF technology:

     Standardization: No doubt there are visualization tools from nearly every CAD vendors which will help view a multitude of product data (e.g., MCAD/ECAD files, MS Office documents) without the authoring application. But all such tools need the downstream consumers to have the same tools which might be difficult considering that manufacturing and support services are likely to be outsourced.  I think Adobe tries to solve this problem with Interactive 3D PDF. “Interactive 3D PDF files look exactly like the original 3D design, regardless of the application used to create it or the environment in which it's viewed.” [http://www.adobe.com/manufacturing/solutions/3d_solutions/] The currently supported CAD formats are:


     Reduction in Total Cost of Ownership: If your product data needs to be viewed across the Realise (Manufacturing), Use/Support (Customer service), Retire/Dispose phases (The phases are from John Stark's PLM Grid) then each user associated with the individual phases will need licenses for a visualization tool. With 3D PDF that cost is cut down. Since Adobe Acrobat is installed in the majority of users – this would also mean a reduced load on IT for installing and maintaining the visualization tool. However a details cost benefit analysis should be made comparing the total license costs of the currently used desktop-based visualization tool versus the cost of the 3D PDF Generator tool (a professional server solution that offers full functionality and accommodates up to 50 users for less than € 10,000).


     Long Term Archival and Retrieval Solution: If the lifecycle of your product extends several decades then a question worth pondering is whether the CAD format would still be supported. While the PDF specification was available for free since at least 2001, PDF was originally a proprietary format controlled by Adobe, and was officially released as an open standard on July 1, 2008, and published by the International Organization for Standardization as ISO 32000-1:2008. In 2008, Adobe published a Public Patent License to ISO 32000-1 granting a royalty-free rights for all patents owned by Adobe that are necessary to make, use, sell and distribute PDF compliant implementations. [http://en.wikipedia.org/wiki/Portable_Document_Format].3D PDF is the perfect candidate for a long term archival and retrieval solution. More information at 3D PDF Consortium http://www.3dpdfconsortium.org/pdf-standards-info.html.
Thanks for reading! I would be happy read your comments.

Friday, October 14, 2011

What Google+ failure can teach about PLM implementation and User Adoption?

A few days back, Google engineer Steve Yegge wrote a classic tirade about Google's inept handling of the Google+ platform. (You can read it all here). Google+ was supposed to be a Facebook killer, but slowly it is turning to be another Google Wave/Buzz. One of the most interesting things pointed out in the blogpost was “The Golden Rule of platforms is that you Eat Your Own Dogfood. The fact that Google doesn’t even eat its own dog food is very evident in this post from a few days back.

As I read this post, I realized how many times we have implemented PLM at various sites and, what the end result has been - all along we have known for a fact that the one of the key measure of a winning and thriving PLM implementation was effective user adoption. And this not mere consultant conjecture, this has been validated by research too - According to a study done by the Sand Hill Group and Neochange, the most critical factor (70% listed as number 1) for software success and return-on-investment is effective user adoption. Software functionality came in at 1% surprisingly, with organization change at 16% and process alignment at 13%. No wonder Google+ has been a nonstarter (Paul Tassi has even written “A Eulogy for Google Plus”)

So what can we learn about Google+ hopeless case and how it relates to a successful PLM implementation from a user adoption standpoint? Several I would say:

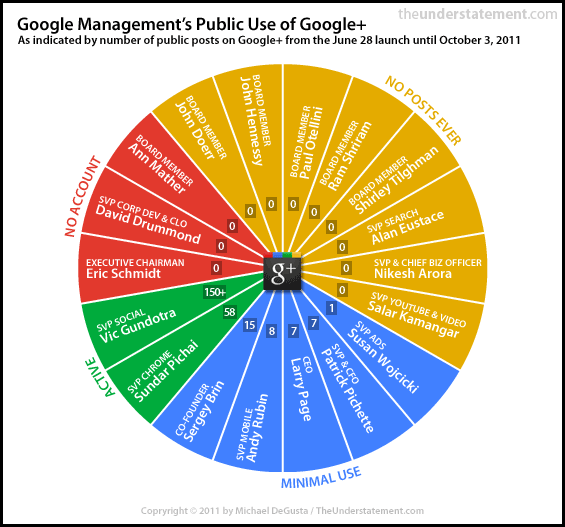
1.     Not Enough Power Users (or Management Support or Practice what you preach): Google's Schmidt finally took to Google+ only a couple of days back. Most members of the company's management team aren't still using Google+. Likewise if your PLM implementation has to be successful the concerned top level management has to use it. No point if the VP or Director of Engg/Rnd still uses emails to approve designs or wants printed copies or whatever completely bypassing the system.

2.     Have Real Value for the End User: If the current PLM system is just a replacement for the old one with lots of cute UI’s and bells and whistle – quite likely the reaction is going to be the same as was with the old one once the initial hype cycle dies down.

3.     Launch when ready: Most people would advocate implementing PLM in phases. Good point. But just because you have to close out one phase to start another doesn’t mean you need to roll out a half baked product/service to the user community.

4.     Vendor Size Doesn’t Matter: Even with an 800 pound gorilla’s backing, Buzz, Wave and now + failed. Likewise even if the vendor is large or their PLM system caters to the biggest of the big Fortune 500 companies, it’s not necessary that it will cater to all your user needs. Give your users what they want to be successful in getting their job done. Don’t focus almost exclusively on tiny little features that few people will ever use.

5.     Customize if needed: Oh yeah, that’s a bad word – We don’t want to customize and keep on paying for the maintenance! Right – But what is the point in using terminology or vendor mandated business processes which the user community doesn’t understand? I still don’t get circles, stream, hangouts or whatever.

6.     Motivate People to Use it: People simply didn’t move in droves from Facebook to Google+ as was expected. There was no motivation to do so. FB was sufficient to satisfy the needs of most of the users. Just because something is mandated by the organization doesn’t mean that the users will use it or be happy to use it (sometimes you don’t have a choice – like using LotusNotes or HP’s Quality Center for example!). Motivate the end users to use the new PLM system – Have a plan much before go-live!

7.     Integration: Well Google+ has probably integration with lots of websites and stuff, but Facebook is better! Host of games and apps and I can even sign into/comment on a bunch of websites using my Facebook id. Similarly if the PLM system doesn’t have integration to systems like corporate LDAP, or the SMTP server or inaccessible externally users would have tough time getting on-boarded.

Probably I can go on and on but I hope readers get the point! Don’t take user adoption unconscientiously – it’s the key to a triumphant implementation. (I wouldn’t underestimate Google though – Maybe this time they will get it right – eventually)

Saturday, September 24, 2011

The under-appreciated role of PLM in implementing Document Creation Retention and Destruction (DCRD) policies


Have you heard about the famous (or infamous?) “Pitt’s Postulate”: “Whenever you think you’ve destroyed the last copy of any document, there’s always one more that exists, and it will surface at exactly the most inopportune time. The only exception, of course, is if you really need the document, at which point you’ll discover that you actually did destroy the very last copy.” – Quite true, isn’t it? Over the last few years businesses have come to appreciate that they need to better manage their documents and records to tackle a number of key issues including legislation's like SOX, risk of lawsuits, protection of intellectual property and identity theft. Most corporations have formalized Document Creation, Retention and Disposal (DCRD) policies, primarily outlining the length of time for which the organization will keep certain documents and records, either in hard copy or electronic form. These policies serve as guiding principles for employees, indicating which documents to discard and which to save while ensuring compliance with laws and hindering inadvertent or ingenuous destruction of records.

Numerous off-the-shelf solutions are available for such purposes (including SharePoint which impelled me to write this article) but if a company has already implemented a commercial PLM system then they in all probability do not need to go for another system to take care of DCRD policies. Record/Document classification, integrity, storage, access control, data retention, backup, data purging, comprehensive version and revision control, viewable file generation, auditing, search etc. are all effectively present in a enterprise PLM system.
 
What are the challenges before trying to get PLM in managing corporate records?

→ Assessment of different document type and their value needs to be determined first – Certain type of documents might not be suitable for storage in PLM like employee evaluations or expense reports etc when other systems are present to manage them.
→ Emails in particular – Time and again emails have been the center of attention in much litigation and unfortunately the retention/control/purge of emails is out of PLM’s scope.
→ Backups – Electronic data backup produce historical copies of documents/records which even though purged from the current system will be preserved in archives and are discoverable.
 
My conclusion: PLM is a viable solution in conjunction with other systems to aid implementation of DCRD policies. If a PLM solution is present then a new Records Management solution doesn’t need to be implemented.

Saturday, September 10, 2011

Securing your PLM Infrastructure (before it’s too late!)

I read an interesting report at Symantec’s website - The average organizational cost of a data breach [in 2010] increased to $7.2 million and cost companies an average of $214 per compromised record, markedly higher when compared to $204 in 2009. The full report is here. Also per the Second Annual Cost of Cyber Crime Study


Cyber attacks have become common occurrences. The companies in our study experienced 72 successful attacks per week and more than one successful attack per company per week. This represents an increase of 44 percent from last year’s successful attack experience.
Pretty frightening huh! I am not sure it would be possible to break up such estimates into a granular level, but data loss from a PLM system would be also very expensive. And that needs to be seriously looked into. With this mission I looked at various PLM vendors websites – all they claimed was that their system was “highly secure” – But how secure is the question? Is there an established criterion or matrices or has it been quantitatively corroborated? CIMData  deals with this topic in their white paper  “TenQuestions to Ask PLM Solution Suppliers - What You Need to Know to Make anInformed Decision” though very briefly.

The risks are not only external but also present due to the fact that today users work from everywhere and not only from their office and even iPad apps are being released by several vendors. Other requirements like ITAR, export control, and other security protocols make it more imminent to secure your PLM environment. I believe during the PLM evaluation phase itself security mechanisms need to be evaluated and security should not be added as an afterthought.
Some of the security measures that come to mind (and nowhere are these comprehensive):
     Application Layer Security
o   Application Security – Including On-site and off-site tape storage, OS hardening, Virus protection on all servers, etc.
o   User Authentication - Access Control and Data classification model. Strike the right balance between sharing information and securing it. See Ford’s slides on Product Data Security and Access Management.
     Data Management Security
o   Data Encryption – 128-bit Secure Sockets Layer (SSL) data encryption, etc.
o   Database Security – minimal open ports, no scott/tiger or Default Password’s (I have seen this a lot!), no master passwords to control access to all systems, No text (property) file passwords!
o   Lock down on file vaulting servers(s)
     Systems Security
o   Internal and Operating Systems Security – Firewalls, network address translation, port redirection, IP masquerading, non-routable IP addressing schemes, DMZ, Intrusion detection systems, etc.
     Data Center Security
o   Physical Security of server farms including biometric authentication for access. (Though one of my customers had an enterprise down scenario when rats gnawed down some of their fiber optic cables)
o   Reliability and Backup –Hardware: UPS battery systems, diesel generators, and HVAC systems – (I saw this first hand when a few years back a snow storm hit a customer site in New England area and power lines were down, they didn’t have diesel generators and UPS battery lasted only for an hour or so causing servers to crash). Disaster recovery sites, Backup tapes also are important.
o   Water Suppression, Fire protection facility in server room.
o   Social Engineering – Do not underestimate the human aspect of security. Ignorant or discontented employees can cause more harm than you can imagine. Former computer hacker Kevin D. Mitnick has a good book on this topic: “The Human Element of Security
Audits and Standards
Facilities can be designed to withstand extreme elements that comply with ISO/IEC 27001 standards. A SAS 70 Type II or SSAE 16 or ISAE 3402  audits can also be done. A comprehensive security assessment and mitigation of risks related to system would bring in peace of mind.
Conclusion
There is a Data Breach Risk Calculator available which will estimate your risk exposure and can calculate amongst others the cost of a data breach at your company.
Organizations should remember the costs involved – What a mid tier firm might have the funds for will be appreciably different from what a Fortune 100 firm would. They should pigeonhole the sets of security features needed based on priority and significance and make practical decisions based on their budget.

Tuesday, September 6, 2011

Using Rule-Based or Supervised Document Classification for Legacy Data Migration in a PLM Implementation

I was reading about Latent Semantic Analysis (LSA, also Latent semantic indexing ) recently and the controversies over whether Google used this technique to rank their search results, though the jury seems to be that they use something much more sophisticated statistical methods of text analysis. Latent semantic analysis (LSA) is a technique in natural language processing, of analyzing relationships between a set of documents and the terms they contain by producing a set of concepts related to the documents and terms. LSA assumes that words that are close in meaning will occur close together in text.

Latent semantic indexing is closely related to LSA and is used in a assortment of information retrieval and text processing applications, although its primary use is for automated document categorization. Document classification/categorization are used to assign an electronic document to one or more categories, based on its contents. Document classification tasks can be divided into two sorts: supervised document classification where some external mechanism (such as human feedback) provides information on the correct classification for documents, and unsupervised document classification (also known as document clustering), where the classification must be done entirely without reference to external information. There is also a semi-supervised document classification, where parts of the documents are labeled by the external mechanism (Rule Based). There are Open Source tools [like Mallet] for statistical natural language processing, document classification, clustering, topic modeling, information extraction, etc.

The reason I bring up this topic in my experience in legacy data import during PLM implementations. Legacy data migration is tough to say the least. Stephen Porter gives a good overview here: The PLM State: What’s thebig deal about data migration?. Some of my real life experiences include:  

1.       Manual scanning of historical documents, manual classification of those documents into folders and uploading it to the PLM environment using vendor tools in a FDA regulated organization’s implementation.

2.       Legacy data extraction from a commercial document management system, mapping data with vendor PLM system, cleaning the legacy data, and finally data import.

3.       Legacy system consolidation - Merging numerous home grown legacy systems into one commercial PLM system.

None of the processes used were scalable or easy to start with. Also the amount of time taken cannot be guaranteed. In such scenarios wouldn’t using Rule-Based or Supervised Document Classification make sense? Arguably CAD data would be difficult to handle and historical revisions or intermediate iterations of files between releases might be lost but probably for non-CAD data using such techniques would make up for huge investments in time and labor for legacy data migrations.

Friday, September 2, 2011

Creative problem solving using Visual Analytics in Product Development


Visual analytics is a new interdisciplinary science aimed at drawing inference and conclusions from data. In contrast to standard machine learning or statistics, visual analytics emphasizes information visualization, interactivity, and analytic reasoning. [http://smlv.cc.gatech.edu/2010/03/17/what-is-visual-analytics/]. It is an outgrowth of the field’s information visualization and scientific visualization, which focuses on analytical reasoning facilitated by interactive visual interfaces. [http://en.wikipedia.org/wiki/Visual_analytics]


If you really want to go into the depths of VA then you can attend a few web lectures from Georgia Tech here

A few years back digg.com had these great visualizations – stack, swarm and big spy; though they seem to be out of service now. (see Where Have Digg Labs Gone?)


A related disciple is text analytics. The term text analytics describes a set of linguistic, statistical, and machine learning techniques that model and structure the information content of textual sources for business intelligence, exploratory data analysis, research, or investigation. [http://en.wikipedia.org/wiki/Text_analytics]

A tag or word cloud is related to text analytics. We all have seen these tag clouds over the past couple of years. Tag clouds are an informative image that communicates much in a single glance. Word clouds are easy to read, analyze and compare, serve a variety of useful purposes including visual analysis of qualitative data. For example using FDA Medical Devices CFR - Code of Federal Regulations Title 21 and TagCrowd I created this visualization (clearly showing that the major emphasis of this regulation is on manufacturers.)

Coming to the PLM domain, if we can process product data in such a method then we can arrive at a number of interesting observation very easily. For example to show which product has how many change requests? Or which product uses the least parts from a standard library. It can be easily done and if there is an enormous amount of data in an organization such visualizations can offer great information to executives very intuitively.


Another great tool I recently saw was from TouchGraph. See this image which displays a person’s network connections from Facebook.


This sort of visualization when brought into an enterprise can easily put in the picture about a multitude of different things, like for example; a change in a standard part is going to affect how many products down the line, etc. I believe Visual analytics will lead to creative problem solving and faster solutions to problems will drive higher product profitability.

Thursday, August 18, 2011

Data Visualization/Infographics in PLM – Will it help make better decisions?

As PLM implementations and usage have matured over time, from being a simple repository of CAD data to a single source of truth, the data locked in these systems have also increased exponentially. This data usually exhibits the key characteristics of good data – being well controlled, accurate, organized, relevant, reliable, and valid. This treasure trove can be harnessed to yield knowledge (which is a series of facts) and intelligence (the ability to think and reason and using and processing the knowledge) and to do that it needs to be properly understood. However till now in most cases such data have been presented only in the form of tabular search results with very little emphasis on mechanisms of illustrating the data in a form which enables a mental picture of what is being revealed.


“The point is that the data [is] good but looking at it and trying to analyze it without an appropriate visual representation will not be helpful in drawing [any types of] conclusions or noticing any patterns. “ [http://veronicatsvetkov.com/2011/04/12/ted-talk-eric-brlow-data-visualization-tableau-public-software/]
Infographics Example 1

I believe Infographics can help here. “Information graphics or infographics are graphic visual representations of information, data or knowledge. These graphics present complex information quickly and clearly, such as in signs, maps, journalism, technical writing, and education. With an information graphic, computer scientists, mathematicians, and statisticians develop and communicate concepts using a single symbol to process information”. [http://en.wikipedia.org/wiki/Information_graphics]

Infographics Example 2

“The adage "A picture is worth a thousand words" refers to the idea that a complex idea can be conveyed with just a single still image. It also aptly characterizes one of the main goals of visualization, namely making it possible to absorb large amounts of data quickly.” [http://en.wikipedia.org/wiki/A_picture_is_worth_a_thousand_words]

Infographics Example 3
Identifying solutions to problems becomes easier if complex data can be easily refined. See ecologist Eric Berlow illustrating the tips and tricks for breaking down big issues, he distills an overwhelming infographic on U.S. strategy in Afghanistan to a few elementary points.


Most of the Inforgraphics I have seen till date seems to be one off creations of artists – Can an automated, scalable, efficient technology deliver infographics that is quickly refreshed with current data? As a matter of fact can we do multidimensional analysis of volumes of product data to get information about the business in a more intuitive way?

Tuesday, June 28, 2011

The World’s Largest Machine and PLM!

When you think about large machines what does come into your mind?

The Caterpillar 797?


Or the Liebherr T 282B?


Or the Krupp's Bagger 288?


Or the NASA's Mobile Launcher Platform?


Well as per the Guinness Book of World Records, CERN’s Large Hadron Collider is the largest and most complex machine ever built.

The Large Hadron Collider (LHC) lies in a tunnel 27 kilometers (17 mi) in circumference, as deep as 175 meters (574 ft) beneath the Franco-Swiss border near Geneva, Switzerland. This synchrotron is designed to collide opposing particle beams of either protons at an energy of 7 teraelectronvolts (7 TeV or 1.12 microjoules) per particle, or lead nuclei at an energy of 574 TeV (92.0 µJ) per nucleus. http://en.wikipedia.org/wiki/Large_Hadron_Collider


More information, facts and figures on the LHC can be found in CERN FAQ – LHC the guide http://cdsweb.cern.ch/record/1165534/files/CERN-Brochure-2009-003-Eng.pdf

PLM Challenges: The primary challenge is the complexity of the whole operation – The accelerator complex consisting of close to 100 million assets. The other challenge is quality as tolerances are measured in µm in an installation of several kilometers. Maintenance and operations are other significant challenges.

The PLM puzzle in CERN is solved by a mix and match of several commercial PLM systems. The Equipment Data Management Service (EDMS) provide the organization with the engineering and equipment data management capabilities.


While probably it has not been easy, but this proves that (commercial) PLM systems can be used in a scientific environment too. 

Monday, April 4, 2011

QR Code and PLM

Yoann some time back wrote an exciting article on Integrating QR-code tag in User form in Aras Innovator (http://bit.ly/dGW2gx). This is a very interesting union! I am surprised to see that not many PLM vendors have QR code generation facilities. For starters QR Code has the capacity to encode 7,089 numeric characters, 4,296 Alphanumeric characters or 2,953 bytes of binary data (http://en.wikipedia.org/wiki/QR_code). 

QR Code was created by Toyota subsidiary Denso-Wave in 1994. As noted in the Denso-Wave’s case studies, QR code is being used in a variety of industries including Order/Product Scanning System for Automotive Parts, Process Control System for Electronic Circuit Boards, Logistics Control System for Food Products, Shipping Control System for Garment Products, etc. These codes contain varied data including product code, expiration date, manufacturing history, shipping destination, color, size, customer data, shipper data, production line, serial number etc.


The potential for QR Codes is limitless.  What’s most exciting is how they take what social media is doing well now, bringing people together with technology, and extending it to enhance the experience (http://bit.ly/i3hs2S). Some suggested uses for QR codes in the AEC (Architectural, Engineering and Construction) industry include using these codes to Link to Technical Information, Testimonials or case Studies and Customer Service (http://bit.ly/eKWU5e) Howcast in a recent blind pitch to Ikea, the company illustrated how video and QR codes could be used to create clear, overlaying instructions to guide consumers through the furniture assembly process. Such technology could be leveraged not only to improve consumer satisfaction, but could very well cut down on customer support costs for the company as well (http://on.mash.to/9FUyO5).


Another interesting article here http://bit.ly/hurw73 shows how QR Codes has been used to foil counterfeiting, for example the counterfeiting of postage stamps. Many countries of Europe as well as Canada and the United States have implemented this scheme, although details vary from one country to the next.


There has been some discussion on identification of drawing using embedded QR codes (http://bit.ly/cyGup4 and http://bit.ly/cyNVe4) but there hasn’t been anything spectacular. QR Code generation is easy with number of sites allowing you to generate simple QR code for free including Google. (Go to http://goo.gl/ and enter the URL of the site which you want your QR code to be generated. Once you have shortened URL, put it in the URL bar and add .qr to it. Click enter and the QR would automatically created). Hopefully PLM vendors will wake up to this reality and provide options for generating such code in their solutions.