Showing posts with label Data Visualization. Show all posts

Monday, November 7, 2011

3D PDF Technology – Where it fits in


I happened to read about PROSTEP PDF Generator 3D in CIMData’s website this weekend which lead me to explore the world of 3D PDF’s. I find interactive 3D PDF files pretty amazing. For those of you who haven’t had a chance to view them please click on this link: http://www.adobe.com/manufacturing/3dpdfsamples/3dsolutions/ to view sample 3D PDF files. There are several examples listed like:

     Turbine engine (PDF, 4.5M, Original CAD format: SolidWorks)

     Jet concept design (PDF, 4.7M, Original CAD formats: Siemens NX, CATIA V5, and Pro/ENGINEER Wildfire)

     Crankshaftassembly (PDF, 3.0M, Original CAD format: Pro/ENGINEER Wildfire)

I observed many tools when I opened these files in Adobe Reader including those to isolate Parts, different Part Rendering Modes including Transparent, Wireframes, Illustrations etc, different Model Rendering Modes, Model Tree highlighting - will highlight different parts in the model, 3D measurement tools, etc. PDF Generator 3D Reader Extensions Module offers the option of activating a large number of additional functions for using the generated 3D PDF documents in Adobe Reader. The recipient can, for example, add comments or fill in certain fields on a form. PDF Generator 3D Rights Management Module allows the information contained in the 3D PDF documents to be protected against access by unauthorized persons. Access rights can be restricted to a specific period of time and if necessary can be revoked when, for example, a document is no longer valid. Overall I feel it’s a good tool for visualization even though rendering and loading takes some time even with a powerful computer. For those interested in the details of the components of PDF Generator 3D have a look here:


I see 3 major advantages of using 3D PDF technology:

     Standardization: No doubt there are visualization tools from nearly every CAD vendors which will help view a multitude of product data (e.g., MCAD/ECAD files, MS Office documents) without the authoring application. But all such tools need the downstream consumers to have the same tools which might be difficult considering that manufacturing and support services are likely to be outsourced.  I think Adobe tries to solve this problem with Interactive 3D PDF. “Interactive 3D PDF files look exactly like the original 3D design, regardless of the application used to create it or the environment in which it's viewed.” [http://www.adobe.com/manufacturing/solutions/3d_solutions/] The currently supported CAD formats are:


     Reduction in Total Cost of Ownership: If your product data needs to be viewed across the Realise (Manufacturing), Use/Support (Customer service), Retire/Dispose phases (The phases are from John Stark's PLM Grid) then each user associated with the individual phases will need licenses for a visualization tool. With 3D PDF that cost is cut down. Since Adobe Acrobat is installed in the majority of users – this would also mean a reduced load on IT for installing and maintaining the visualization tool. However a details cost benefit analysis should be made comparing the total license costs of the currently used desktop-based visualization tool versus the cost of the 3D PDF Generator tool (a professional server solution that offers full functionality and accommodates up to 50 users for less than € 10,000).


     Long Term Archival and Retrieval Solution: If the lifecycle of your product extends several decades then a question worth pondering is whether the CAD format would still be supported. While the PDF specification was available for free since at least 2001, PDF was originally a proprietary format controlled by Adobe, and was officially released as an open standard on July 1, 2008, and published by the International Organization for Standardization as ISO 32000-1:2008. In 2008, Adobe published a Public Patent License to ISO 32000-1 granting a royalty-free rights for all patents owned by Adobe that are necessary to make, use, sell and distribute PDF compliant implementations. [http://en.wikipedia.org/wiki/Portable_Document_Format].3D PDF is the perfect candidate for a long term archival and retrieval solution. More information at 3D PDF Consortium http://www.3dpdfconsortium.org/pdf-standards-info.html.
Thanks for reading! I would be happy read your comments.

Friday, September 2, 2011

Creative problem solving using Visual Analytics in Product Development


Visual analytics is a new interdisciplinary science aimed at drawing inference and conclusions from data. In contrast to standard machine learning or statistics, visual analytics emphasizes information visualization, interactivity, and analytic reasoning. [http://smlv.cc.gatech.edu/2010/03/17/what-is-visual-analytics/]. It is an outgrowth of the field’s information visualization and scientific visualization, which focuses on analytical reasoning facilitated by interactive visual interfaces. [http://en.wikipedia.org/wiki/Visual_analytics]


If you really want to go into the depths of VA then you can attend a few web lectures from Georgia Tech here

A few years back digg.com had these great visualizations – stack, swarm and big spy; though they seem to be out of service now. (see Where Have Digg Labs Gone?)


A related disciple is text analytics. The term text analytics describes a set of linguistic, statistical, and machine learning techniques that model and structure the information content of textual sources for business intelligence, exploratory data analysis, research, or investigation. [http://en.wikipedia.org/wiki/Text_analytics]

A tag or word cloud is related to text analytics. We all have seen these tag clouds over the past couple of years. Tag clouds are an informative image that communicates much in a single glance. Word clouds are easy to read, analyze and compare, serve a variety of useful purposes including visual analysis of qualitative data. For example using FDA Medical Devices CFR - Code of Federal Regulations Title 21 and TagCrowd I created this visualization (clearly showing that the major emphasis of this regulation is on manufacturers.)

Coming to the PLM domain, if we can process product data in such a method then we can arrive at a number of interesting observation very easily. For example to show which product has how many change requests? Or which product uses the least parts from a standard library. It can be easily done and if there is an enormous amount of data in an organization such visualizations can offer great information to executives very intuitively.


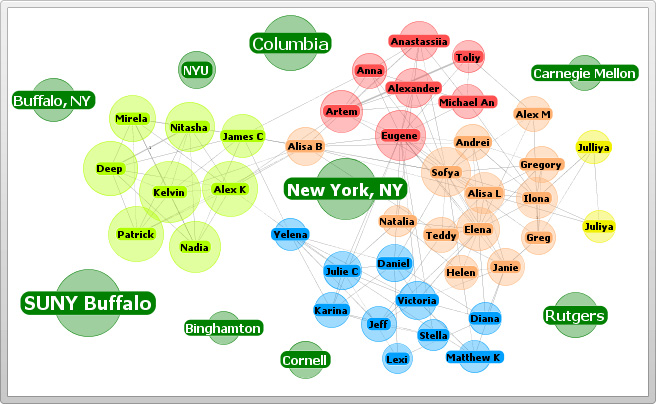
Another great tool I recently saw was from TouchGraph. See this image which displays a person’s network connections from Facebook.


This sort of visualization when brought into an enterprise can easily put in the picture about a multitude of different things, like for example; a change in a standard part is going to affect how many products down the line, etc. I believe Visual analytics will lead to creative problem solving and faster solutions to problems will drive higher product profitability.

Thursday, August 18, 2011

Data Visualization/Infographics in PLM – Will it help make better decisions?

As PLM implementations and usage have matured over time, from being a simple repository of CAD data to a single source of truth, the data locked in these systems have also increased exponentially. This data usually exhibits the key characteristics of good data – being well controlled, accurate, organized, relevant, reliable, and valid. This treasure trove can be harnessed to yield knowledge (which is a series of facts) and intelligence (the ability to think and reason and using and processing the knowledge) and to do that it needs to be properly understood. However till now in most cases such data have been presented only in the form of tabular search results with very little emphasis on mechanisms of illustrating the data in a form which enables a mental picture of what is being revealed.


“The point is that the data [is] good but looking at it and trying to analyze it without an appropriate visual representation will not be helpful in drawing [any types of] conclusions or noticing any patterns. “ [http://veronicatsvetkov.com/2011/04/12/ted-talk-eric-brlow-data-visualization-tableau-public-software/]
Infographics Example 1

I believe Infographics can help here. “Information graphics or infographics are graphic visual representations of information, data or knowledge. These graphics present complex information quickly and clearly, such as in signs, maps, journalism, technical writing, and education. With an information graphic, computer scientists, mathematicians, and statisticians develop and communicate concepts using a single symbol to process information”. [http://en.wikipedia.org/wiki/Information_graphics]

Infographics Example 2

“The adage "A picture is worth a thousand words" refers to the idea that a complex idea can be conveyed with just a single still image. It also aptly characterizes one of the main goals of visualization, namely making it possible to absorb large amounts of data quickly.” [http://en.wikipedia.org/wiki/A_picture_is_worth_a_thousand_words]

Infographics Example 3
Identifying solutions to problems becomes easier if complex data can be easily refined. See ecologist Eric Berlow illustrating the tips and tricks for breaking down big issues, he distills an overwhelming infographic on U.S. strategy in Afghanistan to a few elementary points.


Most of the Inforgraphics I have seen till date seems to be one off creations of artists – Can an automated, scalable, efficient technology deliver infographics that is quickly refreshed with current data? As a matter of fact can we do multidimensional analysis of volumes of product data to get information about the business in a more intuitive way?